Documentation Index
Fetch the complete documentation index at: https://docs.jitera.ai/llms.txt
Use this file to discover all available pages before exploring further.
Chat
I receive the response "Unable to process your inquiry at the moment, please try again"
I receive the response "Unable to process your inquiry at the moment, please try again"
Visual Studio Code Extension
Only a "Copy" button is displayed in the output code, and no "Apply" button appears
Only a "Copy" button is displayed in the output code, and no "Apply" button appears
Can the Visual Studio Code extension chat explore any branch in the repository?
Can the Visual Studio Code extension chat explore any branch in the repository?
I installed the Visual Studio Code extension but cannot log in
I installed the Visual Studio Code extension but cannot log in
How do I troubleshoot errors when applying or logging in?
How do I troubleshoot errors when applying or logging in?
I installed the Jitera extension for VS Code but see a network access issue message
I installed the Jitera extension for VS Code but see a network access issue message
Jitera Eclipse Extension
Is Pleiades All in One Eclipse supported?
Is Pleiades All in One Eclipse supported?
How should I contact support if an error occurs with the Eclipse extension?
How should I contact support if an error occurs with the Eclipse extension?
- Go to Settings > Jitera and change to display the debug menu
- The Jitera menu will now be displayed
- Select Log from the Jitera menu > Get logs from Java
GitHub (SaaS) / GitLab (Self-Hosted) Integration Import
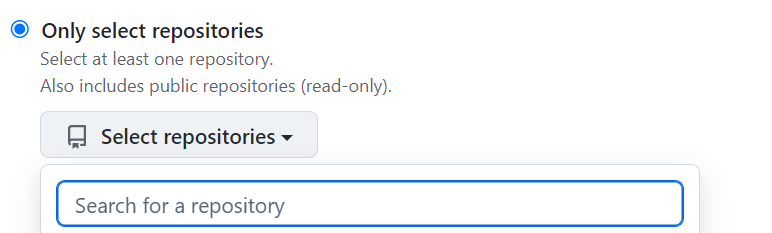
I cannot find the GitHub repository I want to import in the list
I cannot find the GitHub repository I want to import in the list
- Click the “Authorize More Repositories” button to confirm that your GitHub account has authorized Jitera to access the repository you want to import.
- Confirm that your GitHub account has Admin permissions for the repository.
I uploaded several files to a GitHub repository, but the repository name is grayed out and displays "Cannot import empty repository"
I uploaded several files to a GitHub repository, but the repository name is grayed out and displays "Cannot import empty repository"
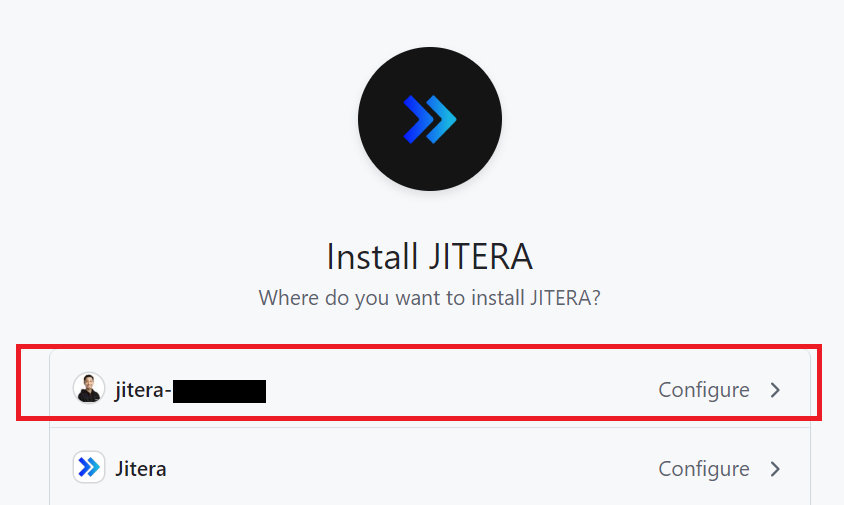
I approved GitHub account authentication, but the username and target repository are not displayed
I approved GitHub account authentication, but the username and target repository are not displayed
The GitHub authentication screen does not complete, or I have to confirm and save the target repository every time I import a new repository. Can I skip this after linking once?
The GitHub authentication screen does not complete, or I have to confirm and save the target repository every time I import a new repository. Can I skip this after linking once?
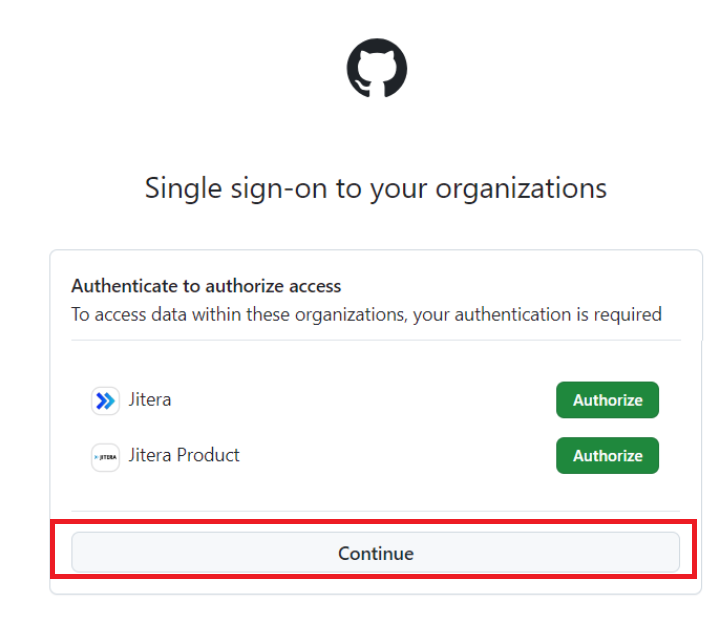
I am redirected to the GitHub application settings screen and cannot proceed
I am redirected to the GitHub application settings screen and cannot proceed
How do I specify a framework or library?
How do I specify a framework or library?
After linking GitHub and Jitera, a branch starting with "Jitera" was created
After linking GitHub and Jitera, a branch starting with "Jitera" was created
I get "Invalid host" or "Access token" errors when linking GitLab
I get "Invalid host" or "Access token" errors when linking GitLab
- Confirm that your GitLab account has admin privileges.
- Verify that the host URL you entered is not the repository URL (the top page URL should be the correct setting).
- Also confirm that your GitLab version is 16.8 or later.
What GitLab versions are supported?
What GitLab versions are supported?
Does GitLab support both Enterprise and Community editions?
Does GitLab support both Enterprise and Community editions?
Is the SaaS version of GitLab supported?
Is the SaaS version of GitLab supported?
Jitera CLI Integration Import
An error occurs during Jitera init and I cannot proceed with the import
An error occurs during Jitera init and I cannot proceed with the import
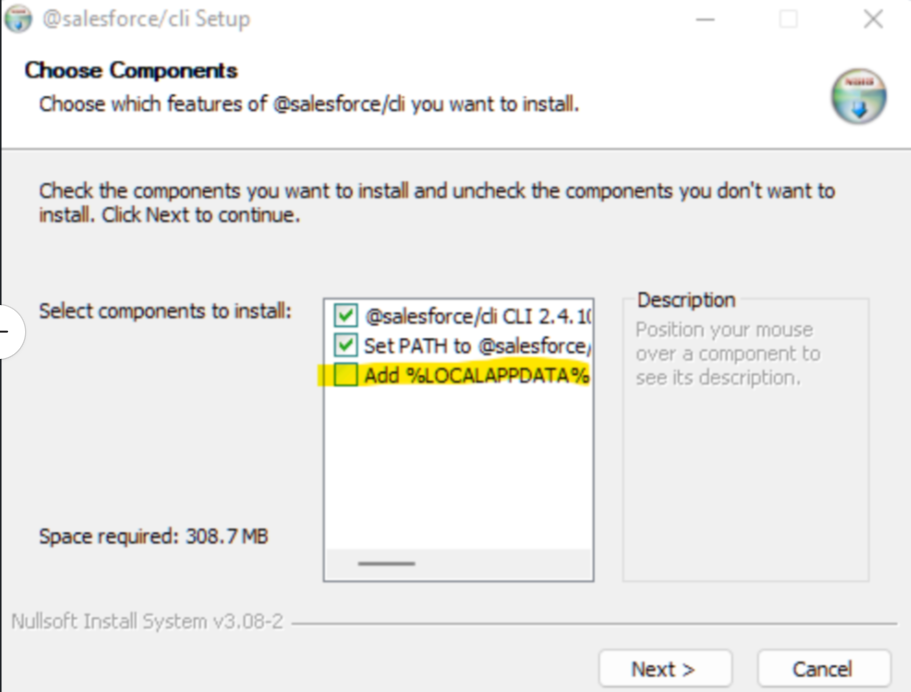
Windows Defender disabling was detected when running Jitera CLI
Windows Defender disabling was detected when running Jitera CLI
Screen (Beta Feature)
I registered test user information, but screens after login are not being detected
I registered test user information, but screens after login are not being detected